Commodity trading has been a cornerstone of the global economy for centuries, and it continues to play a vital role in financial markets. In the complex world of commodity trading online, technical analysis is a powerful tool that can help traders make informed decisions and mitigate risks. In this comprehensive guide, we will explore the various aspects of technical analysis in trading commodities, from understanding the basics to using key indicators, developing strategies, managing risk, and making the most of a commodity trading platform.

Understanding Technical Analysis
What is Technical Analysis?
Technical analysis is a methodology used to forecast the future price movements of commodities or other financial assets based on historical price data and trading volume. It operates on the premise that historical price patterns repeat themselves over time. This approach relies on the idea that a multitude of factors influence market behaviour, and these influences are reflected in the price charts.
The Role of Charts
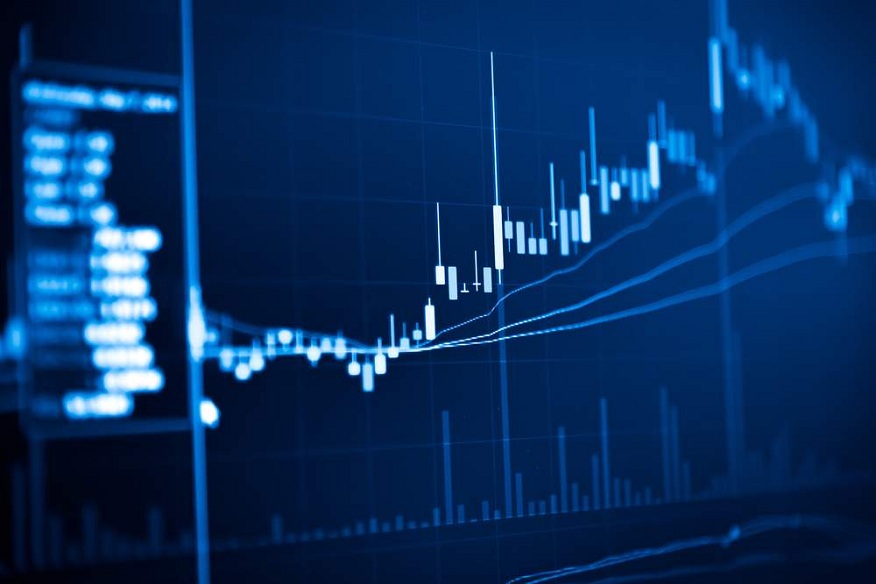
Charts are the primary visual tool in technical analysis. They represent the historical price and volume data of a commodity, allowing analysts to identify patterns and trends. There are various types of charts, such as line charts, bar charts, and candlestick charts, each providing different levels of detail and insight. Candlestick charts, for example, offer a more comprehensive view of price movements, including open, close, high, and low prices for specific periods.
Timeframes and Chart Patterns
The choice of timeframe is a critical consideration when performing technical analysis. Traders can use various timeframes, from minutes to months, depending on their trading style and objectives. Short-term traders may focus on intraday charts, while long-term investors might use daily, weekly, or monthly charts.
Key Technical Analysis Indicators
Technical analysis relies on various indicators that provide additional insights into market conditions. Some of the key technical analysis indicators include:
- Moving Averages: Moving averages are a statistical tool that helps in smoothing out the price data to identify trends. They can be simple (SMA) or exponential (EMA) and help traders spot potential trend reversals.
- Relative Strength Index (RSI): The RSI indicator calculates the velocity and magnitude of fluctuations in prices. It is often used to determine overbought or oversold conditions in the market.
- MACD (Moving Average Convergence Divergence): MACD is a trend-following momentum indicator that can help traders identify potential changes in the trend.
- Bollinger Bands: Bollinger Bands are comprised of a central band (Simple Moving Average or SMA) flanked by upper and lower bands that serve as indicators of price volatility. They help identify price volatility and potential reversals.
- Fibonacci Retracement: Fibonacci retracement levels help identify potential support and resistance based on the Fibonacci sequence.
Technical Analysis Strategies
- Trend Following: A trading strategy that involves recognising and trading in line with the current trend. Traders use moving averages, trendlines, and other indicators to confirm trend direction.
- Swing Trading: Swing traders aim to capitalise on short to medium-term price swings within a more significant trend. They often use technical indicators like RSI and MACD to time their entries and exits.
- Contrarian Trading: Some traders practice contrarian trading, which involves going against the prevailing market sentiment. They look for divergences and overbought/oversold conditions to identify potential reversals.
- Breakout Trading: Breakout traders focus on price movements that breach crucial support or resistance levels. Chart patterns like triangles and rectangles are often associated with breakout trading.
Risk Management and Psychology
Successful trading requires effective risk management and a strong understanding of the psychological aspects of trading. Traders should:
- It is important to establish both stop-loss and take-profit levels to minimise potential losses and secure profits.
- Avoid over-leveraging and use proper position sizing to manage risk.
- It is important to control emotions and adhere to the trading plan.
- Continuously improve their skills and knowledge to adapt to changing market conditions.
Trade Risk-Free with Commodity Trading Platfrom
Commodity trading platforms in South Africa provide a valuable opportunity for traders to hone their skills and strategies without risking real capital. An online trading brokerage platform like Banxso offers demo accounts that enable users to practice trading in a simulated environment. By utilising real-time data, advanced charting tools, and a wide range of commodity trading in SA, aspiring traders can refine their technical analysis skills and develop a deeper understanding of the market dynamics. These risk-free environments are a crucial stepping stone for traders to gain experience and confidence before venturing into the competitive world of trading commodities with actual funds.


